AE 14: Modelling penguins with multiple predictors
In this application exercise we will continue to study penguins. The data can be found in the palmerpenguins package and we will use tidyverse and tidymodels for data exploration and modeling, respectively.
Body mass vs. flipper length and island
Next, we will expand our understanding of models by continuing to learn about penguins. So far, we modeled body mass by flipper length, and in a separate model, modeled body mass by island. Could it be possible that the estimated body mass of a penguin changes by both their flipper length AND by the island they are on?
- Demo: Fit a model to predict body mass from flipper length and island. Display the summary output and write out the estimated regression equation below.
# add code here\[ add~math~text~here \]
Additive vs. interaction models
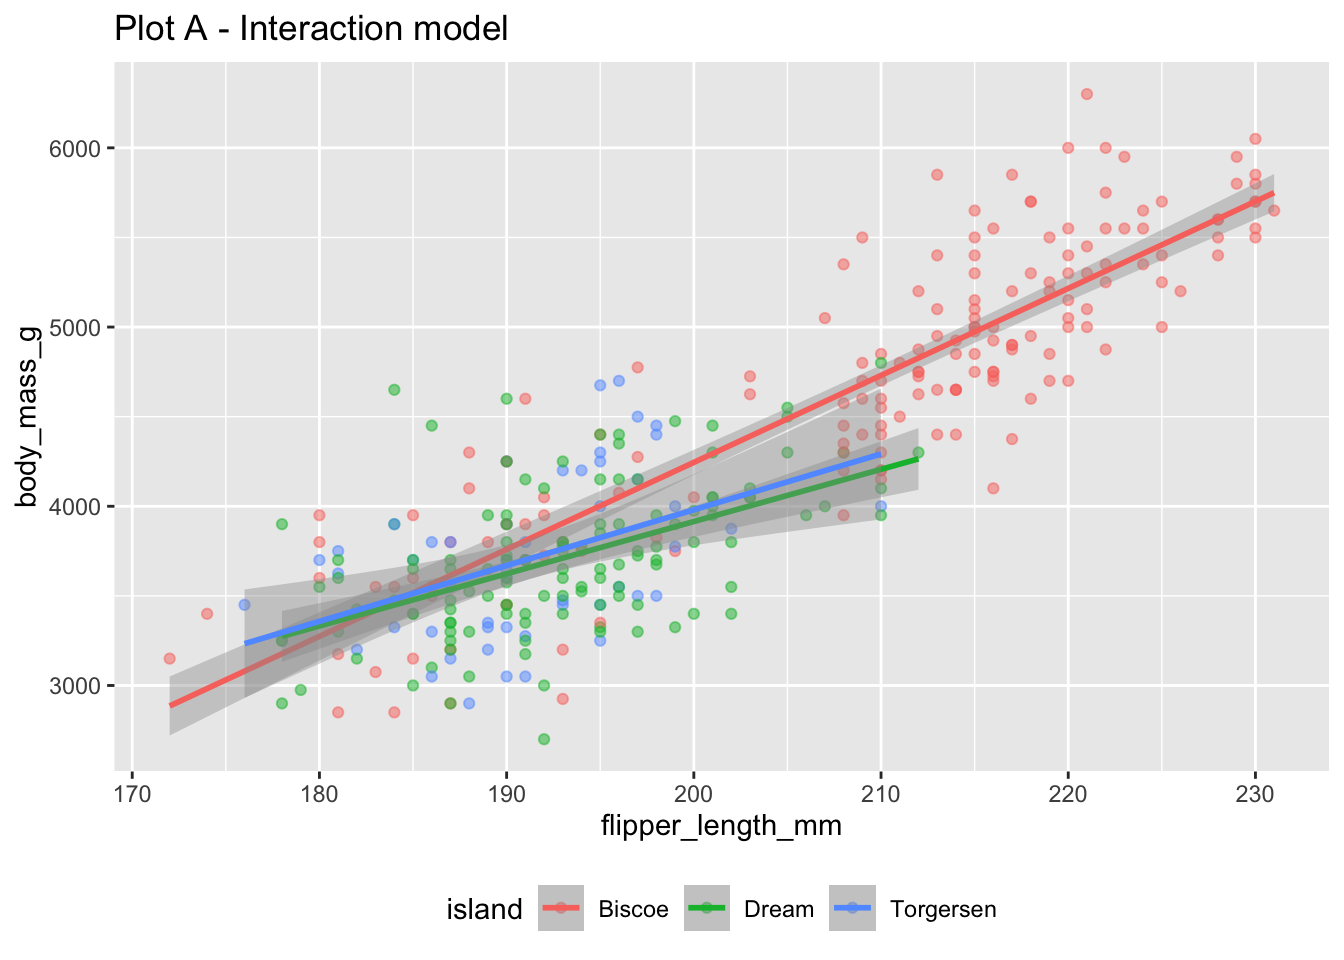
- Your turn: Run the two chunks of code below and create two separate plots. How are the two plots different than each other? Which plot does the model we fit above represent?
# Plot A
ggplot(
  penguins,
  aes(x = flipper_length_mm, y = body_mass_g, color = island)
  ) +
  geom_point(alpha = 0.5) +
  geom_smooth(method = "lm") +
  labs(title = "Plot A - Interaction model") +
  theme(legend.position = "bottom")
`geom_smooth()` using formula = 'y ~ x'Warning: Removed 2 rows containing non-finite outside the scale range
(`stat_smooth()`).Warning: Removed 2 rows containing missing values or values outside the scale range
(`geom_point()`).# Plot B
bm_fl_island_aug <- augment(bm_fl_island_fit, new_data = penguins)
ggplot(
bm_fl_island_aug,
aes(x = flipper_length_mm, y = body_mass_g, color = island)
) +
geom_point(alpha = 0.5) +
geom_smooth(aes(y = .pred), method = "lm") +
labs(title = "Plot B - Additive model") +
theme(legend.position = "bottom")
Error in eval(expr, envir, enclos): object 'bm_fl_island_fit' not foundError in eval(expr, envir, enclos): object 'bm_fl_island_aug' not foundAdd response here.
- Your turn: Interpret the slope coefficient for flipper length in the context of the data and the research question.
Add response here.
- Demo: Predict the body mass of a Dream island penguin with a flipper length of 200 mm based on the additive model.
# add code here- Review: Look back at Plot B. What assumption does the additive model make about the slopes between flipper length and body mass for each of the three islands?
Add response here.
- Demo: Now fit the interaction model represented in Plot A and write the estimated regression model.
# add code here\[ add~math~text~here \]
- Review: What does modeling body mass with an interaction effect get us that without doing so does not?
Add response here.
- Your turn: Predict the body mass of a Dream island penguin with a flipper length of 200 mm based on the interaction model.
# add code hereChoosing a model
Rule of thumb: Occam’s Razor - Don’t overcomplicate the situation! We prefer the simplest best model.
# add code here- Review: What is R-squared? What is adjusted R-squared?
Add response here.
Your turn
- Now, explore body mass, and it’s relationship to bill length and flipper length. Brainstorm: How could we visualize this?
Add response here.
- Fit the additive model. Interpret the slope for flipper in context of the data and the research question.
# add code hereAdd response here.
